On August 4, 2026, Redfin announced that Park Slope had become the hottest luxury neighborhood in the United States. The zip code 11215 beat out suburbs in Illinois and Kansas for the top spot, and the press release traveled fast, landing on PRNewswire, Patch's Brooklyn desk, and a handful of trade outlets within days.
Buried in Redfin's own numbers, released the same week, was a second fact that got far less attention: the number of homes that actually sold in that zip code fell 17.9 percent year over year during the same window. A neighborhood can be named the hottest market in the country and still see fewer transactions close than it did the year before. Both things happened in Park Slope this winter, and understanding why matters more than the headline itself if you're pricing a home here right now.
What the ranking actually counted
Redfin's methodology is narrower than the headline suggests. Analysts looked at zip codes across the 100 largest U.S. metro areas, kept only the ones where median sale prices sat in the 65th percentile or above for their metro, then ranked what was left by two things: year over year growth in listing views on Redfin.com, and a proprietary Compete Score that measures how hard it is to win a bid based on days on market, the share of homes selling above list price, and the sale to list ratio.
To even qualify, a zip code needed at least 50 recorded home sales between January 1 and February 28, 2026, and a Compete Score above 50. Every figure in the report reflects that eight week window, compared against the same eight weeks in 2025.
That means the ranking is measuring three specific things, not the health of an entire neighborhood:
- How much more attention listings got online, not how many listings there were
- How aggressively buyers competed for the homes that did come to market
- A narrow late-winter slice of the calendar, not the full spring or summer selling season
Park Slope's luxury median sale price came in at $1.77 million for that window, up 10.6 percent from a year earlier, more than double the citywide luxury median of $795,000. Listing views were up 34.4 percent. Those are real numbers. They just describe demand for a shrinking pool of homes, not a broad acceleration of the market.
The sentence sitting next to the headline
Redfin's senior economist Asad Khan framed the report around luxury buyers pushing forward "unfazed by high mortgage rates and an uncertain global economy." That's a fair read of buyer behavior. It says nothing about seller behavior, and seller behavior is where the more interesting story sits.
Coverage of the same report noted that Park Slope's prices rose even as the number of homes sold there dropped nearly 18 percent, a combination that points to fewer sellers testing a market that keeps rewarding the ones who do list. Fewer listings chasing more attention will always look like heat on a chart. It can also mean something closer to a standoff: owners who bought in over the past decade are in no hurry to sell into an uncertain rate environment, and the handful who do list are getting bid up precisely because there's so little competition for buyers to choose from.
What was happening on the ground the same season
Redfin's own live neighborhood data tells a slightly different story once you move past the winter luxury snapshot and into the broader spring market. Over the three months ending May 2026, Park Slope's median sale price across all property types was $1.9 million, up 12.8 percent year over year, but homes were taking an average of 47 days to sell compared with 31 days the year before. Only 78 homes sold in May 2026, down from 89 the prior year.
Zoom into the Park Slope Historic District specifically, the roughly 2,500-building landmarked core designated in 1973 that includes the neighborhood's most recognizable brownstone blocks, and the pattern holds. Over the three months ending March 2026, the median sale price there was $2.0 million, up just 2.7 percent year over year, with average days on market stretching to 49 from 34 and only 34 homes selling that month against 48 the year before.
PropertyShark's second quarter 2026 figures for the wider Park Slope market show a median sale price of $1.8 million, up 21.3 percent year over year, but on a total of 99 deals, down 16.8 percent from the same quarter in 2025. A separate market analysis covering the three months ending April 2026 put the median at $1,749,350, with a 100 percent sale to list ratio, only 5.7 percent of homes selling above asking price, and 25.1 percent of active listings carrying a price cut.
None of these figures contradict each other so much as they measure different slices of the same neighborhood in different months. Read together, the pattern is consistent: fewer homes are trading hands across nearly every dataset, days on market are lengthening rather than compressing, and the price growth being reported depends heavily on which few properties happened to close during that particular window.
Two Park Slopes, one zip code
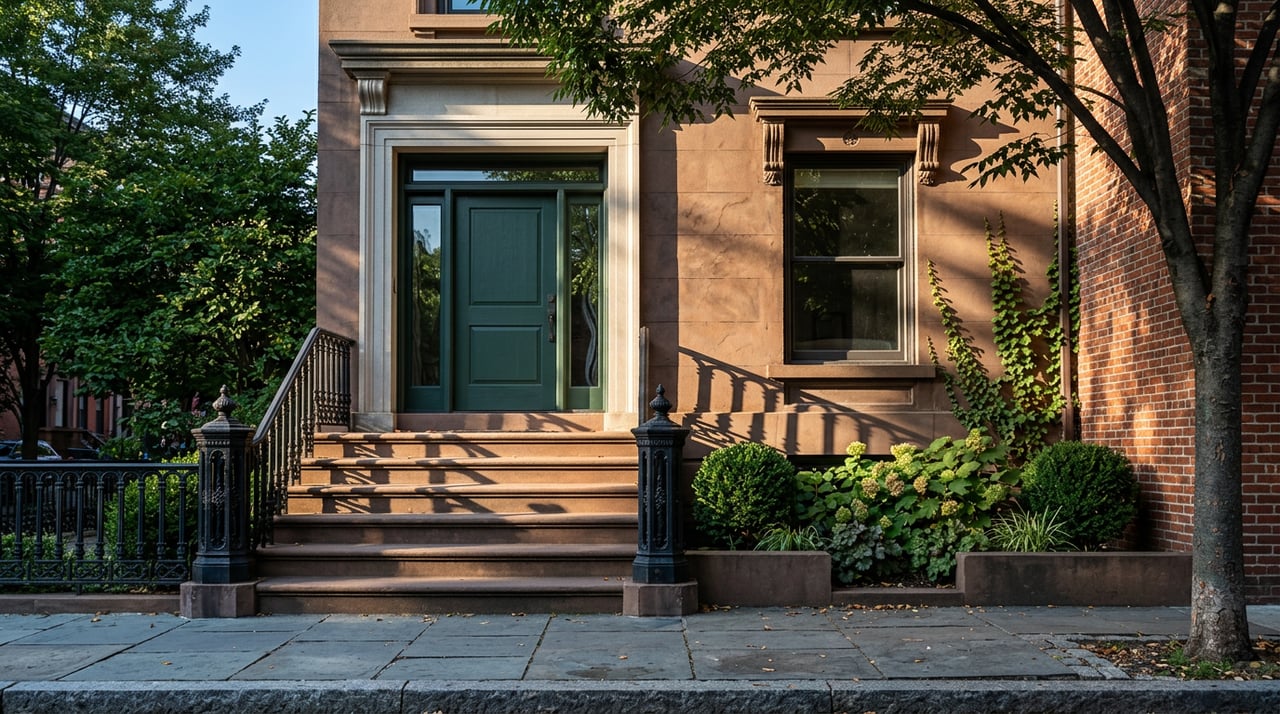
The 11215 zip code Redfin ranked isn't a single housing product. It stretches from the Fourth Avenue corridor, where new glass and steel condo towers have added most of the neighborhood's inventory over the past decade, to the brownstone blocks running along Carroll Street, Montgomery Place, and the numbered streets closest to Prospect Park, where landmark protections and a fixed housing stock keep supply permanently tight.
Those two markets don't move together. A renovated four-story brownstone in Park Slope sold for $4.85 million in February 2026, the kind of sale that pulls a luxury median upward on its own. Recent listings in the neighborhood have included a 4,400-square-foot Italianate townhouse on 6th Avenue asking $6.75 million, a 30-foot-wide house built on the site of a former limestone bank on 10th Street asking $5.48 million, and a five-story home on Montgomery Place designed by architect C.P.H. Gilbert. Homes like these are scarce by design. There is no new supply of prewar brownstones on landmarked blocks, which is exactly the kind of scarcity that produces the bidding-war behavior Redfin's Compete Score is built to capture.
Condos along Fourth Avenue face a different reality. New construction there has added meaningfully to the neighborhood's total unit count over the past several years, which means buyers in that segment have more to choose from and more room to negotiate, even while the brownstone belt a few blocks away stays tight.
What this means if you're pricing a home here
A national ranking tells you where attention is flowing. It doesn't tell you what your specific block, block width, or property type is worth this month. Before you lean on a headline to set expectations for a Park Slope sale or offer, it's worth doing three things:
- Pull comps from the same property type and the same few blocks, not a neighborhood-wide median that blends brownstones, co-ops, and new condos into one number.
- Check the most recent days on market for that specific segment. A landmarked brownstone on a prime block and a Fourth Avenue condo are behaving on very different timelines right now.
- Confirm whether any exterior work on a landmarked property will need Landmarks Preservation Commission review before you set a listing timeline, since that process can add months a headline ranking never accounts for.
Park Slope earned its spot on a national list this year, and the demand behind that ranking is real. The version of the market that shows up in your own transaction depends on which two months, which blocks, and which kind of home you're actually looking at. That's the kind of read that comes from working the neighborhood block by block rather than reading it off a press release.
If you're weighing a sale or a purchase in Park Slope this season and want a pricing picture built from actual recent closings on your block rather than a national average, the Peter Mancini Team can put together a comparison worth trusting. Get Your Home Valuation to see what your specific block is doing right now.