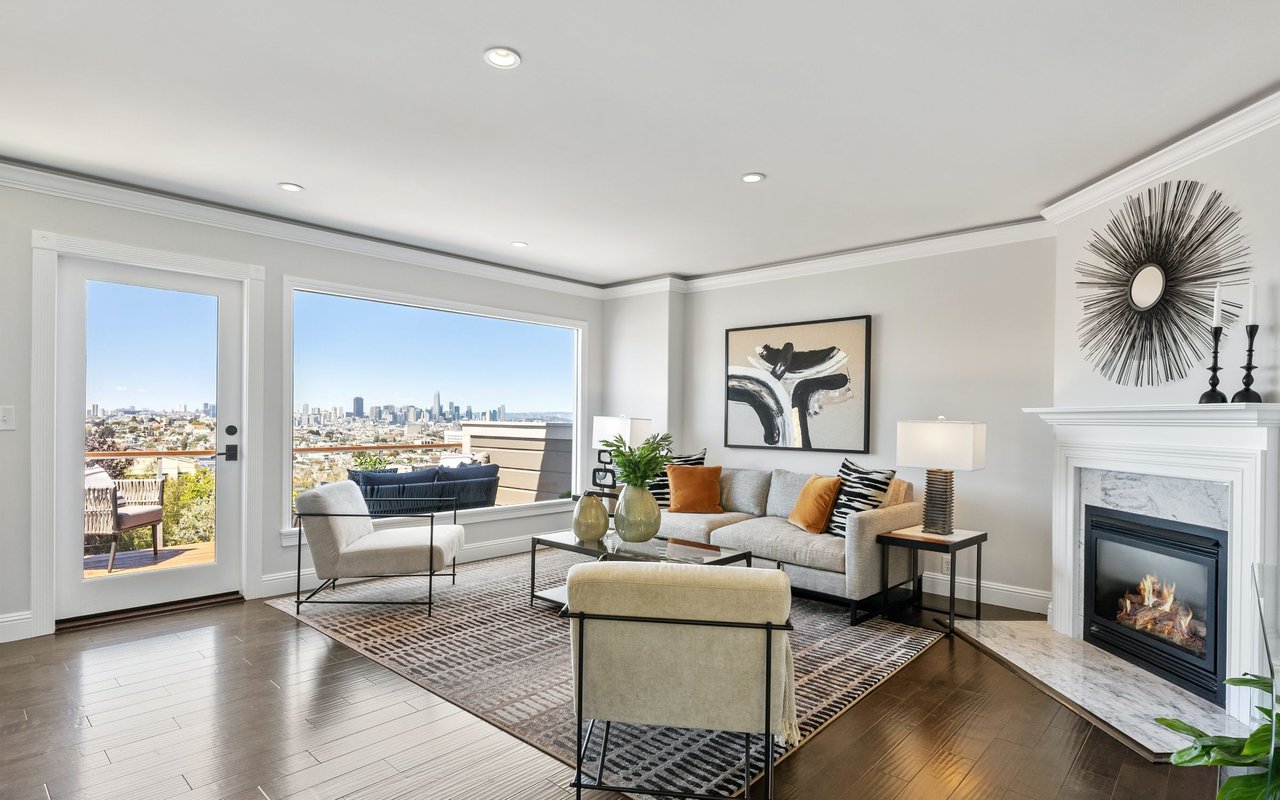
In July, city records showed that Amy Schumer had sold her Brooklyn Heights townhouse at 19 Cranberry Street for $11 million. She and her husband had paid $12.25 million for the 19th-century house in 2022. They listed it for $14 million in March, cut the price by $1.25 million in July, and closed at a $1.25 million loss from their purchase price four years earlier.
That single sale tells you almost nothing about where Brooklyn Heights prices are headed. And that is, in a strange way, the entire point of this post. In a neighborhood this small, one closing can move the whole conversation, and the numbers being quoted about this market right now are proof of exactly that.
Two Numbers, Same Zip Code, Same Spring
Here is the contradiction I keep running into when clients send me headlines about Brooklyn Heights.
One widely used sale-price tracker put the neighborhood's median home price at roughly $2.7 million in its most recent monthly read this spring, a jump of about 92 percent from the same period a year earlier, at close to $1,510 per square foot, with homes taking a median of 57 days to sell.
PropertyShark's own monthly read on Brooklyn Heights, covering May 2026, shows something almost unrecognizable next to that. Broken out by property type, the median house sale price held essentially flat year over year at $8.2 million. The median condo price fell 14.3 percent to $2.6 million. The median co-op price fell 34.4 percent to $600,000.
So which is it? Did Brooklyn Heights prices nearly double, or did an entire category of housing lose a third of its value in twelve months? Neither answer is true on its own, and that is exactly why this neighborhood is a bad candidate for headline-level price reading.
"The market in Brooklyn Heights used to be a value alternative for buyers who wanted more space than they could find in the city. It's now a direct competitor to the Village and Upper East Side for some of New York City's wealthiest people."
That's Ravi Kantha of SERHANT, describing the appeal of a very different kind of Brooklyn Heights property: 192 Columbia Heights, a 25-foot-wide mansion built in 1856, recently renovated by Belgian architect Nicolas Schuybroek, and marketed at $16 million. The quote is about prestige and buyer psychology, not about a market-wide trend line. But it's worth sitting with, because it explains why one property at that price level can distort a median more in Brooklyn Heights than it would almost anywhere else in the borough.
Why One Median Can't Speak for Three Markets
Brooklyn Heights was designated New York City's first historic district in 1965, and most of the neighborhood still sits inside that landmark boundary today. That matters for prices in a very specific way: it caps how much new inventory can enter the market in any given month, which means the number of actual closings tracked by any data source is small to begin with.
When a neighborhood's monthly closing count is small, a median stops behaving like a stable measurement and starts behaving like a coin flip weighted by whatever happened to trade. A $600,000 studio co-op closing in the same month as an $8.2 million townhouse doesn't average into a meaningful number. It produces a median that reflects which few deals happened to cross the finish line, not what values actually did.
That's the mechanism behind the 92 percent jump. It's very likely not that Brooklyn Heights homes got 92 percent more valuable in a year. It's that the mix of what closed shifted toward higher-priced product in that particular window, the same reason PropertyShark's condo and co-op medians moved sharply in the opposite direction. Fewer co-op sales closing in a given month means each individual sale carries more statistical weight, and a couple of below-market or distressed co-op closings can swing that median by a third without reflecting anything about the health of co-op ownership in the neighborhood generally.
Co-op boards across brownstone Brooklyn have also grown more deliberate this year. Buyers have gotten more sensitive to post-purchase liquidity requirements and flip taxes, and that caution shows up as longer approval timelines rather than as a single dramatic price signal. A 34 percent one-year drop in a co-op median is a symptom of thin volume meeting board friction, not a verdict on co-op value.
What Actually Moved This Spring
Strip away the percentages and look at what closed and what's on the market right now, and the picture gets calmer.
- Across the borough's prime row-house belt, which includes Brooklyn Heights alongside Park Slope, Cobble Hill, Boerum Hill, and Carroll Gardens, brownstones traded between roughly $1.4 million and $3 million this spring, with fully restored single-family houses clearing $4 million on the tightest blocks.
- Amy Schumer's Cranberry Street townhouse closed at $11 million in July, a $1.25 million loss from its 2022 purchase price, after a $1.25 million price cut earlier that summer.
- At 171 Columbia Heights, a 1,786-square-foot two-bedroom duplex inside the Standish, a converted Beaux-Arts hotel that now operates as full-service condo living, was asking $3,995,000, with room to add a third bedroom.
- 192 Columbia Heights, the renovated 1856 mansion, was marketed at $16 million, a price level far above the neighborhood median in either direction.
None of those four data points, taken alone, tells you what a typical Brooklyn Heights home is worth. Taken together, they tell you the range is wide and the closings are few, which is exactly why the headline median swings so hard from month to month. The 57-day median time on market is actually the steadier number in this picture. It hasn't moved into the kind of extreme territory you see in nearby DUMBO, where marketing time has stretched to roughly 220 days from about 71 a year earlier on a much smaller number of luxury closings.
What This Means If You're Pricing a Home Here Right Now
If you're selling a brownstone, a condo, or a co-op in Brooklyn Heights this fall, the neighborhood median is close to useless to you. It's not measuring your building. It's measuring whichever handful of properties happened to close last month, at whatever price points those specific sellers and buyers agreed to.
What actually matters is price per square foot on truly comparable recent closings in your building type and on your block, and how that compares to the roughly $1,250 to $1,510 per square foot range that both DUMBO and Brooklyn Heights have held through the volatility in their headline medians. A restored single-family house doesn't compete on the same axis as a co-op unit two blocks away, and pricing either one off a blended neighborhood number invites a listing that sits or a valuation that spooks you unnecessarily.
If you're buying, the same logic protects you from both directions of the story. A 92 percent jump doesn't mean you missed the market. A 34 percent co-op drop doesn't mean there's a fire sale waiting for you. It means you need someone pulling actual comparable closings, not repeating whichever headline came up first in a search.
FAQs
Does the 92 percent median jump mean Brooklyn Heights home values nearly doubled this year?
No. It reflects a shift in which properties happened to close in a given month, weighted toward higher price points, in a market with very few monthly transactions. Price per square foot, which held in the $1,250 to $1,510 range, is a steadier read on actual value.
Why did the co-op median drop so much if the overall neighborhood looks strong?
Co-op sales in Brooklyn Heights are infrequent enough that a small handful of closings can swing the median dramatically. Slower board approvals and buyer caution around liquidity requirements and flip taxes have also stretched timelines, which changes which units close in any given month.
What number should I actually trust if I'm pricing my home this fall?
Recent closed sales in your specific building type and price per square foot on comparable properties. The 57-day median time on market is also a more stable signal than the price median right now, since it hasn't been distorted by the same small-sample swings.
If you're trying to figure out what your Brooklyn Heights home is actually worth in a market where the headline numbers contradict each other by design, that's exactly the kind of conversation the Peter Mancini Team has with clients every week. Get in touch for a current home valuation grounded in real comparable sales, not a neighborhood median that's telling two different stories at once.